Monitor
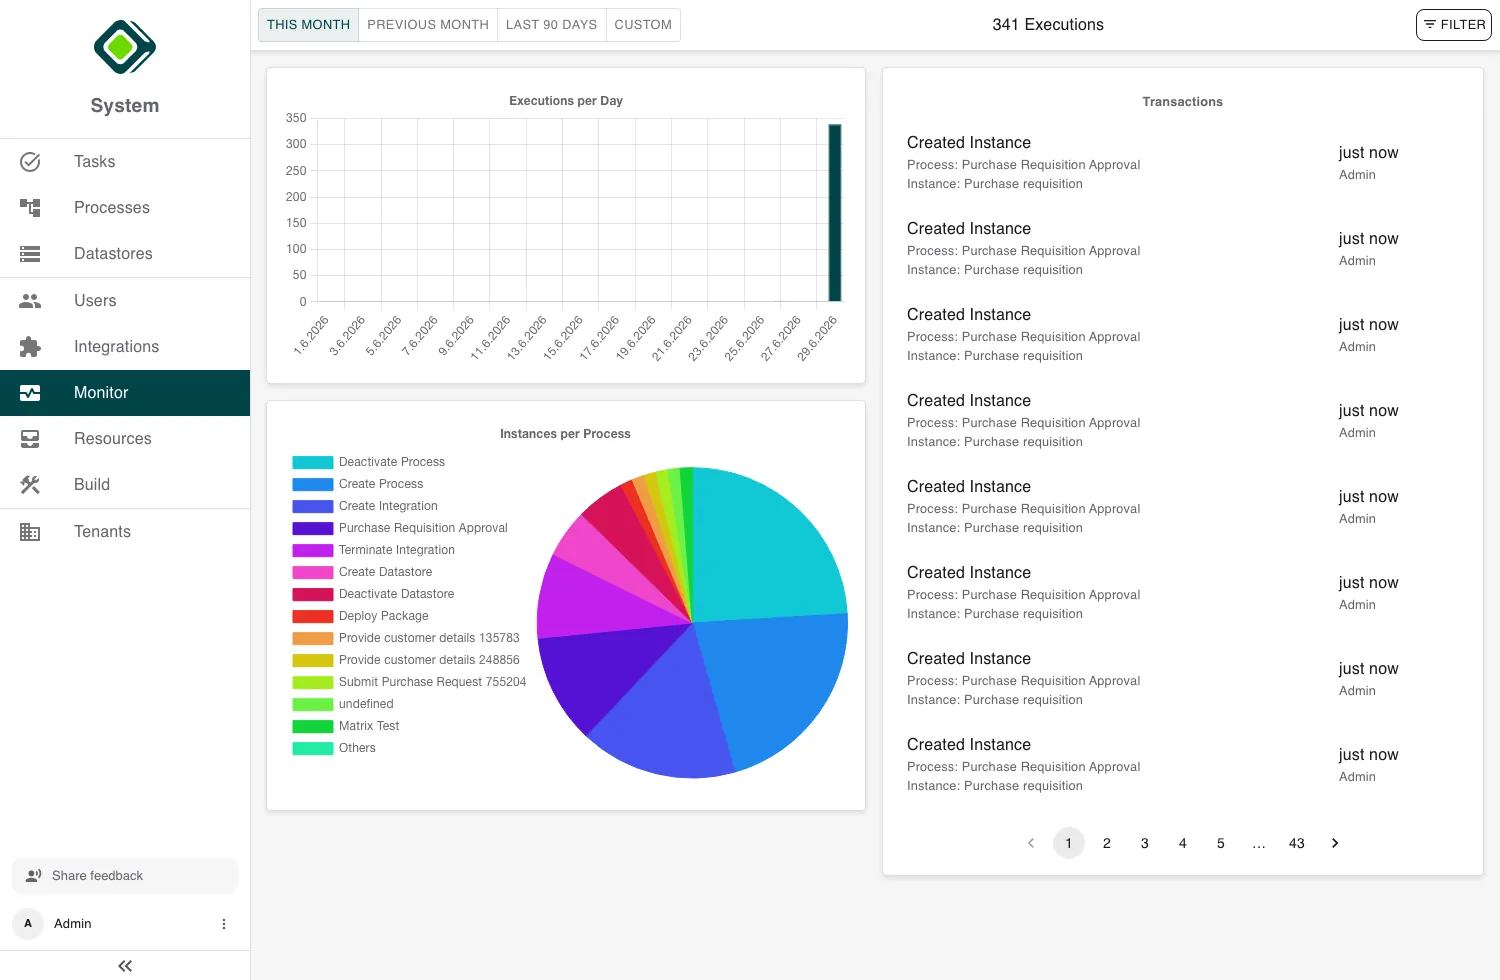
Monitor is the operational view across the whole workspace. Where an instance view shows one run, Monitor shows the activity of all of them: how much is executing, which processes are busiest, and a feed of every transaction you can drill into.
Monitor is an admin area - it’s where you keep an eye on the platform and diagnose problems.
Choosing a time range
A time filter scopes everything on the page. Pick This Month, Previous Month, Last 90 Days, or Custom (with From and To dates). The page shows how many transactions fall in the range.
The charts
Two charts summarise activity in the selected range:
- Executions per Day - a bar chart of transaction volume over time. Spot spikes, quiet periods, and trends.
- Instances per Process - a pie chart of which processes account for the most instances (the busiest few, with the rest grouped as Others).
The transaction feed
Below the charts, Transactions is a paginated feed of individual events - each step execution, instance creation, and abort across the workspace.
Each row names the action (the step that ran, or Created Instance / Abort Instance) and the instance and process - or the datastore - it touched. Click any transaction to open its detail.
This is the trail you follow when something misbehaves: find the transaction, open it, and trace it back to its instance.
To investigate a specific failure, it’s often quicker to open the failing instance directly from Processes and read its Execution History. Use Monitor for the wider view - volume, busiest processes, and finding a transaction when you don’t already have the instance.
Related
- Process Instance View - drill from a transaction into the instance that produced it.
- Processes - the processes whose activity Monitor aggregates.
- Integrations → Troubleshooting - diagnosing connector-related failures.